Summary
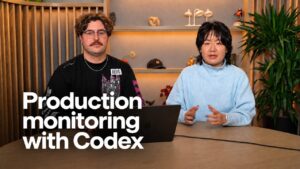
OpenAI walks through how Codex can help engineers respond to production incidents, starting from the classic 3 a.m. page when checkout errors are climbing. Using a custom skill, Codex gathers evidence from a Grafana dashboard, deployment context and the relevant code, then proposes a fix. In the first scenario, a release pushed the checkout error rate to around 20%; after the engineer typed approve, the patch shipped and errors returned to zero without rolling back to an older release.
A second demo extends the approach to Kubernetes. A new inventory API version passes CI/CD but is OOM killed, causing cascading failures across the orders API and edge gateway. A Kubernetes rollout investigator skill identifies the causal chain, prepares a patch, and restores the cluster after human approval.
The presenters also describe running self-hosted runners inside Kubernetes, Grafana or other observability platforms so Codex can respond to alerts automatically, and even chaining multiple agents to validate fixes. A final example pairs production monitoring with Codex Security to keep a service continuously available, showing how an engineer stays in the loop while offloading repetitive investigation work.
📺 Source: OpenAI · Published October 08, 2026
🏷️ Format: Tutorial Demo